


A centrepiece was this chart:
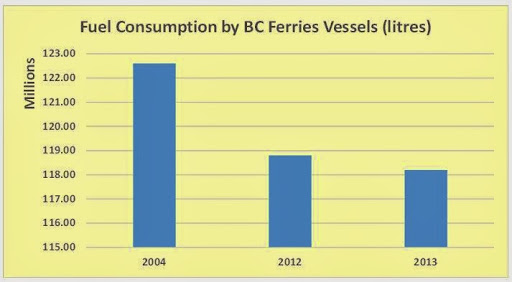
I added the above version in response to a comment by Ms. Anonymous, December 10, 2013 at 9:36 PM. The original version remains below. Obviously, it is not much different.

Looks pretty good. Maybe worth another bonus or two. Except, here is the same information portrayed differently.
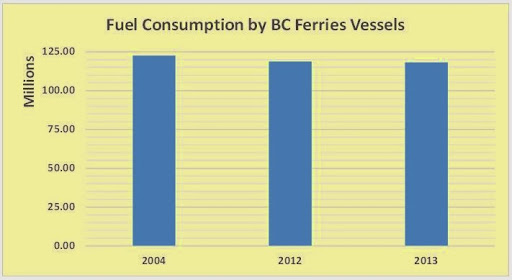
Not quite as impressive. But wait. BC Ferry’s traffic has been steadily declining. In 2013, vehicle and passenger movements were 27.7 million and in 2004, the total was 31.3 million. So, if we look at litres of fuel consumed for each unit of traffic, changes in fuel consumption look like this.
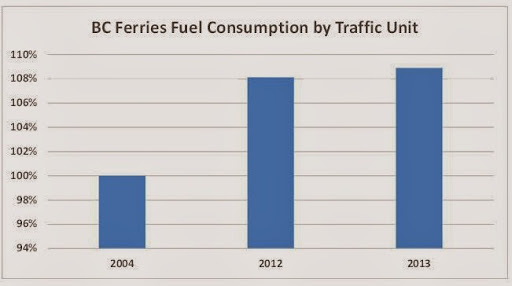
Indeed, the quantity of fuel expended to haul one vehicle or one passenger on a BC Ferries route increased, on average, by 9% since 2004. Truth, my friends, is opposite of what the ferry corporation and its media echo chamber wants you to know.
Categories: BC Ferries


Not like you at all Norm ……having the origin of your “y” (not “x”) axis off by 0.8% of the median value graphed. Glad to see a prompt correction. I printed out your original graph with the 115 figure and the correct one with 116. If you place one on top of the other and hold up to the light you can really see how different the bars are in length. I bet you an “AEQ” anonymous above agrees. Don't try this at home because you need to recover from your eye surgery….no straining allowed.
Absolutely an insult to the intelligence of the electorate having BC Hydro publish such a graph. Your graph with “0” as the origin is clearly what a competent analyst would be using to form a plan of action. Unless of course the analyst's competency was in public relations, not math.
Anonymous above was so taken aback upon discovery of your gross graphical misrepresentation he/she missed the definition published by the BC Ferry Commission for “unit of traffic”. Understandable.
Here it is.
“BC Ferries provided the number of sailings and the total lift-off capacity,
measured in auto-equivalent units (AEQs), for each month on each route
from November 1993 to March 2010. These data were compared to total
traffic in each route group, assuming that 1 bus = 3 AEQ and 1 truck = 4
AEQ. This comparison for the major routes is illustrated below.”
LikeLike
If this bothers you, keep checking back. There's more coming.
LikeLike
Obviously it would have been easier just to copy the graphs as originally provided by BC Ferries with a source line (as is normally done in reseach papers) but Norm here wants to present “his” “facts.
LikeLike
You're right, Norm. I'm an idiot. That's why I don't want anyone to know my name.
LikeLike
A chart adjusted to show the axis starting at 115 million litres, instead of 116 milllion is now included above. I doubt the commenter wants an answer to the latter question. Generally, the obvious needs no explanation.
LikeLike
Are these original charts or those constructed by Norm? The top one is not an original as it is displayed, The “X” axis begins at 116, the original 115, the label on the original correctly shows the consumption units, Norm's does not, so it is a bit deceptive as is the second. What exactly is a “unit of traffic”? There are varied capacities on the ferries as there are different capacities. How do these charts compare to originals provided by BC Ferries?
LikeLike
Always be wary of charts that don't start at zero! That first one was very deceptive. Good catch, Norm!
All the best with your recovery.
LikeLike
Had BC Ferries wanted to be pioneers in LNG powered ferries, they'd have acted more than a decade ago. Norway has been in the LNG ferry business for years.
However, the last thing Canada's energy industry wants to encourage is Canadian examination of Norways energy policies. It would cost the multinationals billions every year if we followed Norway's lead.
LikeLike
Using BC Ferry's chart trickery against them – nice.
LikeLike
Must be trying to cover for the last German built fuel guzzlers in preparation for the announcement of further purchases. LNG should be mandatory. Much whining about the dangers of it. PABsters or whatever they are called lately most likely. Wonder if these same people are worried about a 1200 km pipeline operating at 1760 psi to get gas to a port to be liquified. Or the propane bottle hooked to their barbecue.
LikeLike