

Massachusetts Institute of Technology publishes MIT Climate Portal, a useful site for important matters of science. It warns that hydropower may not live up to the expectations of clean energy advocates.
Poorly planned hydropower can also cause more problems for the climate than it prevents. Hydro plants need large reservoirs to provide a steady stream of water. When these reservoirs are built, plants and other organic matter get flooded. This material decays over time, releasing greenhouse gases like carbon dioxide and methane. According to [John Parsons, an energy economist with MIT’s Center for Energy and Environmental Policy Research], there hasn’t been much research measuring these emissions…
Why aren’t we looking at more hydropower?
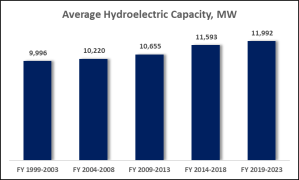
Hydroelectric facilities are dependent on consistent supplies of water to keep the turbines working. By updating and adding to generating facilities, BC Hydro has increased its hydroelectricity capacity by 20 percent in the past 25 years.
But electricity produced at hydro dams for each megawatt of capacity has steadily declined. According to BC Hydro’s Annual Reports, output in the first period charted below was 22 percent higher that in the most recent period.
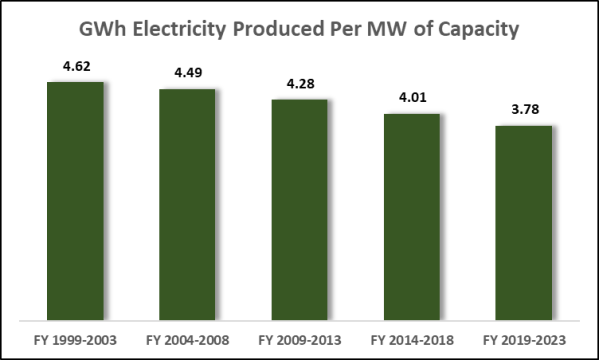
Site C was conceived when output per MW of capacity was higher than it has been in recent years. BC Hydro has regularly claimed that 1,100 MW capacity at Site C will annually produce 5,100 gigawatt hours (GWh) of electricity. That would be 4.64 GWh per MW of capacity, almost a quarter more output than BC Hydro’s dams have collectively produced in the last five fiscal years.
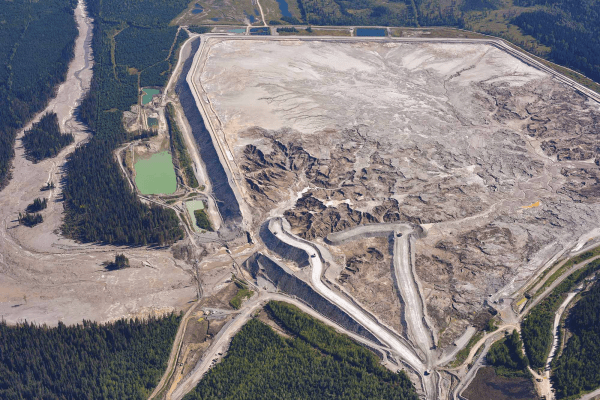
Site C has the extra disadvantage of being constructed on unstable land. Because of that, energy produced will be the costliest large source of electricity in BC. If Site C produces only 4,100 GWh of electricity each year, the energy will be unconscionably expensive. But then, engineers never make mistakes, do they?

If Site C fails, it will be western Canada’s greatest financial disaster since, um, the decision to go ahead with the Trans Mountain Pipeline.

The public cannot know the levelized cost of Site C power since we do not know the end cost of the the facility. Its budget has not been updated since it was almost doubled in early 2021. Another problem is that the life span of the new dam is unknown since it is being constructed on unstable ground.
When Site C was budgeted at $7.9 billion, estimates said it would produce electricity at a cost between $87 and $95 per megawatt hour at the point of interconnection. With the cost now expressed at $16 billion, a quick calculation suggests electricity from Site C will cost $130/MWh to $160/MWh, or more if the final cost turns out even higher than the 2 1/2 year-old budget admitted to by BC Hydro. The utility also faces huge cost for transmission lines to deliver power to LNG companies. Sarah Cox reported:
The B.C. government wants taxpayers across Canada to pay half the $3-billion bill for a new electric transmission line supplying power to the province’s LNG industry, including projects owned by some of the world’s most profitable oil and gas companies, according to a confidential briefing note obtained by The Narwhal.
LNG Canada wants to go electric. The B.C. government wants taxpayers to cover the cost
When Site C was given a green light by BC Liberals and approved by BC NDP in 2017, alternative power sources were already less expensive than the Peace River project. Since then, renewables have gone down in price and Site C power has gone up.
Study shows expected wind power cost declines of 37%-49% by 2050.
U.S. Department of Energy
Technology and commercial advancements are expected to continue to drive down the cost of wind energy, according to a survey of the world’s foremost wind power experts led by Lawrence Berkeley National Laboratory (Berkeley Lab). Experts anticipate cost reductions of 17%–35% by 2035 and 37%–49% by 2050 under a median or best-guess scenario, driven by bigger and more efficient wind turbines, lower capital and operating costs, and other advancements. The findings are described in an article in Nature Energy, with further details on the Berkeley Lab website.


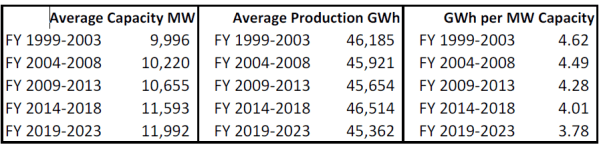
I hope I have been using your numbers in an appropriate way… but when I take the ‘green’ numbers and multiply them by the corresponding ‘blue’ numbers above them… all of the answers end up in the same ballpark.
The low range is 45,330 (most recently) and the highest is 46,487 from the 2014-2018 readings.
IF I’ve used the numbers correctly, they say that Hydro has been flat-lining its production of power since 1999 — despite dumping billion$ into increasing its capacity.
(If I’m wrong, please scrub this post.)
LikeLike
Barry, you are correct. The production of hydroelectricity has been consistent despite increases in capacity and updates to generating capacity. I added a table with numbers underlying the charts.
One factor is reduced water flows, but increasing IPP commitments during 16 years of flat demand had an impact too. There have been times when BC Hydro released water without generating electricity. Had export markets been stronger, they might have sold more surplus power.
LikeLike
IPP has been around for 16 YEARS ?!
That was Campbell’s doing?
or Clark’s
LikeLike
Not entirely. BC Hydro’s contractual commitments to IPPs increased by $4.5 billion in the 2022-23 fiscal year just reported.
LikeLike
I’ve never used Twitter, nor ‘X’, therefore not able to to see what is happening on the ‘other side of the links ‘.
Whereas, using your keywords: Canary Media Source: BNEF, RMI X-Change: Electricity 2023
the result is
https://www.canarymedia.com/articles/clean-energy/charts-renewables-are-on-track-to-keep-getting-cheaper-and-cheaper
LikeLike
Canary Media was launched by the Rocky Mountain Institute. While aimed primarily at Americans, I believe both are trustworthy information sources.
LikeLike
Great work Norm. You should be congratulated for disclosing the essentials of a slow happening “train wreck”. Climate change and the consequences of it has been available to see for those who cared to look.
My references were and are the glaciers on our Coast Range Mountains, especially on their Eastern flank. I started seeing them from the air in 1967 . Ever since the shrinkage has been noticeable by looking for the “skirts” , as they receded up their respective mountains.
I can not recall anyone at the BCUC, BC Hydro or the Government of BC ever giving serious consideration to this issue/change. If anyone has a historical public document disclosing otherwise please share.
Cheers, Erik
LikeLike
Thanks, that’s an interesting perspective I had not known about.
LikeLike
I guess we’ll see about Site C soon enough. Apparently they’re going to flood the reservoir soon – no exact date yet, of course. Then all that beautiful farmland will be underwater, and no doubt the cost of electricity will increase.
LikeLike